- May 3, 2010
- 2,662
- 0
- 0
Would it not be useful to work out the power output for the duration of the attack rather than the base of the climb?

OK, well that just validates my point.Le breton said:Thanks Alex, I wrote 1 m/s but meant 1 km/h and did the calculation for 1 km/h because I read your post too fast.
(which is a bit stupid as I chose 21.6 km/h to have exactly 6 m/s)
I rechecked everything before posting but not that
0.32m^2 may or may not be low in that situation, but like I said, pushing that number up simply means the range of power to account for possible wind variation gets wider, not narrower.Le breton said:On the CdA, 0.32 is really VERY LOW FOR A 67 kg RACER IN CLIMBING POSITION.
You must have exceptionally good smooth roads where you are and use exceptional tyres/tubes. Can I come train on your roads?Le breton said:For the Crr, I have measured it personnally on a 5km strech of road quite similar to many roads in France and obtained 0.0036. I am quite happy to use 0.004 as suggested by analyticcycling.com.
Alex Simmons/RST said:........
What methodology are you using to calculate/measure Crr?
.
Le breton said:...........
Plotted kJ/km - after subtracting gravity PART - as a function of velocity and extrapolated to 0 km/h, WHERE YOU ONLY HAVE THE EFFECT OF Crr.
Interesting. Long post to follow split to enable posting of several images.Le breton said:I chose two points on a mountain pass about 5km apart
....
What method do you use?
).
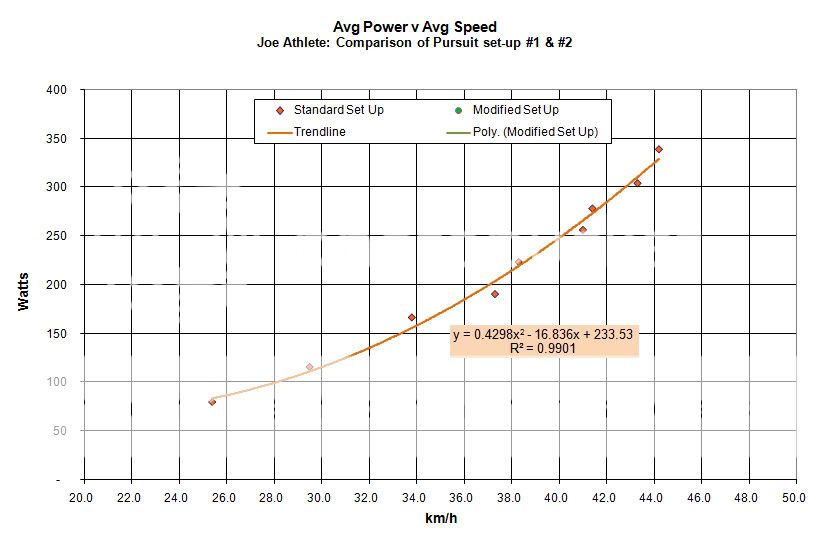

Alex Simmons/RST said:.............That data then provides us with the relationship between force (N) required to maintain a given steady state speed (m/s) - which is curvilinear of course:
Le breton said:I obviously have not had the time to read in detail everything you wrote.
So, just one remark .
Your analysis and data-taking techniques are well suited for flat land biking and well suited to measure CdA.
However to determine Crr you need to have data points at very low velocities where the weight of the rolling resistance contribution is not dwarfed by the air resistance.
What about if he is sick?Chuffy said:Just out of interest, has this kind of exercise been done on David Moncoutie? With his reputation, wouldn't he be useful in establishing a baseline?
I know I'm probably trying to teach you to suck eggs! It was just a thought.Escarabajo said:What about if he is sick?
I think we have some ranges where we can start judging suspicious performances. Even though we have a lot of critics of those ranges, specially the young fans in this forum that believe that evolution can take place in 10-20 years.
It looks like that my calculation was pretty close.Lanark said:It looks like that Chris Horner will publish his SRM data during this Tour, just like he did last year. That should make it a lot easier to make an accurate estimate of the others riders' power.
He also published his Tour of California data, he did Sierra Road with 434 Watt (6,68 W/kg), in 17 minutes. I think some estimates were posted on this forum earlier that were really close to this.
http://www.srm.de/index.php/de/srm-blog/strasse/639
halamala said:Chris Horner
Tour of California 2011, Stage 4, Final climb Sierra Rd
Elevation / Höhenmeter [m] : 532 m
Distance / Streckenlänge [Km] : 5.63 Km
Time in seconds / Fahrzeit in Sekunden [sec] : 1004 = 16 min 44 sec = 16:44
Weight rider / Gewicht Fahrer [kg] : 63.5 kg
Weight bicycle, clothes etc. / Gewicht Fahrrad [kg] : 8 kg
Grade / mittlere Seigung : 9.4 %
Average speed / mittlere Geschwindigkeit : 20.1 Km/h
Total weight / Gesamtgewicht : 71.5 kg
Power : 434.7 Watt
Power / kg : 6.8 Watt / kg
Source: [ http://www.rst.mp-all.de/bergauf.htm ]
I hope he'll release the SRM file later.
)I think this will be OK as an answer:tobsie said:Could someone explain all the power stuff to me - how much wattage is an indication for PEDS? I read somewhere that when the wattage reaches 6,1 w/kg for more than xx minutes, you should start asking questions.
PM me so the thread stays clean, or just send a link where I can read about it
(Mods, delete if this isn't okay
Thanks.halamala said:Preliminary calculation
Tour de France 2011, Stage 12, Luz Ardiden
Frank Schleck
Elevation / Höhenmeter [m] : 979 m
Distance / Streckenlänge [Km] : 13.3 Km
Time in seconds / Fahrzeit in Sekunden [sec] : 2241 = 37 min 21 sec = 37:21
Weight rider / Gewicht Fahrer [kg] : 67 kg
Weight bicycle, clothes etc. / Gewicht Fahrrad [kg] : 8 kg
Grade / mittlere Seigung : 7.4 %
Average speed / mittlere Geschwindigkeit : 21.3 Km/h
Total weight / Gesamtgewicht : 73.0 kg
Power : 394.6 Watt
Power / kg : 5.8 Watt / kg
Source: [ http://www.rst.mp-all.de/bergauf.htm ]
halamala said:Preliminary calculation
...
Weight rider / Gewicht Fahrer [kg] : 67 kg
Weight bicycle, clothes etc. / Gewicht Fahrrad [kg] : 8 kg
Total weight / Gesamtgewicht : 73.0 kg
...
Oh, thanks. Fixed. It doesn't effect to power & power/kg. It's still "Power : 394.6 Watt, Power / kg : 5.8 Watt / kg".marcozero said:67 + 8 = 75 kg.
halamala said:Oh, thanks. Fixed. It doesn't effect to power & power/kg. It's still "Power : 394.6 Watt, Power / kg : 5.8 Watt / kg".
halamala said:Preliminary calculation
Tour de France 2011, Stage 12, Luz Ardiden
Frank Schleck
Elevation / Höhenmeter [m] : 979 m
Distance / Streckenlänge [Km] : 13.3 Km
Time in seconds / Fahrzeit in Sekunden [sec] : 2241 = 37 min 21 sec = 37:21
Weight rider / Gewicht Fahrer [kg] : 67 kg
Weight bicycle, clothes etc. / Gewicht Fahrrad [kg] : 8 kg
Grade / mittlere Seigung : 7.4 %
Average speed / mittlere Geschwindigkeit : 21.3 Km/h
Total weight / Gesamtgewicht : 75.0 kg
Power : 394.6 Watt
Power / kg : 5.8 Watt / kg
Source: [ http://www.rst.mp-all.de/bergauf.htm ]


