
Climbing Speeds
Page 18 - Get up to date with the latest news, scores & standings from the Cycling News Community.
You are using an out of date browser. It may not display this or other websites correctly.
You should upgrade or use an alternative browser.
You should upgrade or use an alternative browser.
- Apr 3, 2009
- 12,961
- 9,135
- 28,180
veganrob said:Also, don't belive a thing that the bike manufacturers say. They all claim their bike is the fastest. Yet, the best rider can switch to any bike and still be the best.
Both can be true. It just proves that in most cases it's 99% rider and 1% bike...at best.
- Nov 12, 2010
- 4,253
- 1,315
- 18,680
Dear Wiggo said:How much does the bike play a part in the aerodynamics for a ride + bike system? Pretty sure the rider takes up 80-90% of the drag component, and bike itself is < 10%.
Here's some actual numbers, either measured or calculated. In my opinion it says the whole "bike improvement explains increase in speed" BS is just that: BS.
http://www.cyclingpowerlab.com/CyclingAerodynamics.aspx

I agree with you 100%. The improvements in the bike technology actually would have resulted in a few watts being saved ~1-2% maybe even less. What has changed is the rider position on the bike. The prime example being Obree. In a single stroke, he "improved" his bike so much that none of the top bike manufacturers have been able to match it till date. The bike has to fit the rider and not the reverse way. There is more access to wind tunnels leading to optimized changes in position of the rider on the bike. What has happened is that bike are probably being more customized to fit the riders need, with the result being lower CdA leading to faster times. These are being stated as "Bike improvements". If just the bikes were to be tested, all top end bikes would come out to be the nearly the same.
- Jul 18, 2010
- 1,320
- 43
- 10,530
That is ludicrous. CFD is too imprecise where the margins for error are slimmest: estimating boundary layer separation, turbulence effects, and particularly Coandă effect.Parker said:So you don't think Pinarello or Sky have computer modelling? I see the luddites are still clinging to the wind tunnel - sure that tells you something but its not the only solution. Most testing is done on computers these days....
There are only three reasons to use CFD: 1. Your error budget is quite high, 2. You're going to vet the CFD data in a wind tunnel, or 3. You can't afford wind tunnel time.
If you want precise numbers, there is no substitute for a wind tunnel.
According to Ranier Pivit's wind tunnel data, the bike is about 30% of aerodynamic drag in mass start trim, most of which comes from the wheels (spinning spokes). Time trial bikes run 45-55% of aero drag, the higher figure the result wind tunnel position tweaking and a disciplined rider.
Man first broke the sound barrier in 1947, built a Mach 3.5 jet in 1962 and first walked on the moon in 1969, so it is pretty naïve, IMHO, to assume aerodynamics was still a black art before Lance Pharmstrong invented the wind tunnel (while on a coffee break from curing cancer). It bears noting that Greg Lemond's average ITT speed in the final stage of the 1989 TdF remains the second fastest ITT > 20 km in TdF history.
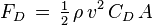
It also is naïve to believe there is anything like a 1-to-1 correlation between either increase in rider effort or decrease in drag and increase in speed. Aerodynamic drag increases exponentially with velocity, not linearly. According to Pivit's data, using a generic rider model, riding 40 kph takes ~368 Watts to overcome total drag, aero and mechanical (88% and 12%, respectively) combined. 41 kph needs ~394 Watts, a 7% increase. 2.5% faster needs a 7% increase in output or an equivalent reduction in drag.
Which means that if you are counting on superior bike aero producing the extra 1 kph, the bike would have to be 27% slicker in mass start trim.
After the 1989 TdF, Steve Hed conducted roll-out testing and determined that Greg Lemond's aero helmet and clip-on aero handlebars set-up was 22% slicker than Laurent Fignon's 'John Lennon' glasses, bare head, ponytail and standard drop bars. That 22% aero advantage allowed him to be 3.6% faster over the 24.5 km course. A 22% gross advantage only netted Lemond a 3.6% time difference.
thehog
BANNED
- Jul 27, 2009
- 31,285
- 2
- 22,485
StyrbjornSterki said:That is ludicrous. CFD is too imprecise where the margins for error are slimmest: estimating boundary layer separation, turbulence effects, and particularly Coandă effect.
There are only three reasons to use CFD: 1. Your error budget is quite high, 2. You're going to vet the CFD data in a wind tunnel, or 3. You can't afford wind tunnel time.
If you want precise numbers, there is no substitute for a wind tunnel.
According to Ranier Pivit's wind tunnel data, the bike is about 30% of aerodynamic drag in mass start trim, most of which comes from the wheels (spinning spokes). Time trial bikes run 45-55% of aero drag, the higher figure the result wind tunnel position tweaking and a disciplined rider.
Man first broke the sound barrier in 1947, built a Mach 3.5 jet in 1962 and first walked on the moon in 1969, so it is pretty naïve, IMHO, to assume aerodynamics was still a black art before Lance Pharmstrong invented the wind tunnel (while on a coffee break from curing cancer). It bears noting that Greg Lemond's average ITT speed in the final stage of the 1989 TdF remains the second fastest ITT > 20 km in TdF history.
It also is naïve to believe there is anything like a 1-to-1 correlation between either increase in rider effort or decrease in drag and increase in speed. Aerodynamic drag increases exponentially with velocity, not linearly. According to Pivit's data, using a generic rider model, riding 40 kph takes ~368 Watts to overcome total drag, aero and mechanical (88% and 12%, respectively) combined. 41 kph needs ~394 Watts, a 7% increase. 2.5% faster needs a 7% increase in output or an equivalent reduction in drag.
Which means that if you are counting on superior bike aero producing the extra 1 kph, the bike would have to be 27% slicker in mass start trim.
After the 1989 TdF, Steve Hed conducted roll-out testing and determined that Greg Lemond's aero helmet and clip-on aero handlebars set-up was 22% slicker than Laurent Fignon's 'John Lennon' glasses, bare head, ponytail and standard drop bars. That 22% aero advantage allowed him to be 3.6% faster over the 24.5 km course. A 22% gross advantage only netted Lemond a 3.6% time difference.
......and leading on from this EVERY cycling team in the ProTour is crunching and comparing their riders TT numbers in training and racing.
Comparative analysis is the cornerstone in improving performance.
Why do these zany Skybots lose their brains?
There is good reason Sky don't release these details. Very good reasons.
- May 26, 2010
- 28,143
- 5
- 0
StyrbjornSterki said:That is ludicrous. CFD is too imprecise where the margins for error are slimmest: estimating boundary layer separation, turbulence effects, and particularly Coandă effect.
There are only three reasons to use CFD: 1. Your error budget is quite high, 2. You're going to vet the CFD data in a wind tunnel, or 3. You can't afford wind tunnel time.
If you want precise numbers, there is no substitute for a wind tunnel.
According to Ranier Pivit's wind tunnel data, the bike is about 30% of aerodynamic drag in mass start trim, most of which comes from the wheels (spinning spokes). Time trial bikes run 45-55% of aero drag, the higher figure the result wind tunnel position tweaking and a disciplined rider.
Man first broke the sound barrier in 1947, built a Mach 3.5 jet in 1962 and first walked on the moon in 1969, so it is pretty naïve, IMHO, to assume aerodynamics was still a black art before Lance Pharmstrong invented the wind tunnel (while on a coffee break from curing cancer). It bears noting that Greg Lemond's average ITT speed in the final stage of the 1989 TdF remains the second fastest ITT > 20 km in TdF history.
It also is naïve to believe there is anything like a 1-to-1 correlation between either increase in rider effort or decrease in drag and increase in speed. Aerodynamic drag increases exponentially with velocity, not linearly. According to Pivit's data, using a generic rider model, riding 40 kph takes ~368 Watts to overcome total drag, aero and mechanical (88% and 12%, respectively) combined. 41 kph needs ~394 Watts, a 7% increase. 2.5% faster needs a 7% increase in output or an equivalent reduction in drag.
Which means that if you are counting on superior bike aero producing the extra 1 kph, the bike would have to be 27% slicker in mass start trim.
After the 1989 TdF, Steve Hed conducted roll-out testing and determined that Greg Lemond's aero helmet and clip-on aero handlebars set-up was 22% slicker than Laurent Fignon's 'John Lennon' glasses, bare head, ponytail and standard drop bars. That 22% aero advantage allowed him to be 3.6% faster over the 24.5 km course. A 22% gross advantage only netted Lemond a 3.6% time difference.
LeMond talked on competitor radio that his helmet created more drag during that TT against Fignon because he kept looking down
")
martinvickers
BANNED
- Oct 15, 2012
- 4,903
- 0
- 0
Any chance bike design, aerodynamics and TT's could be discussed...I dunno...on a bike design, aerodynamics or TT thread?
edit, btw that doesn't include Sceptic's first post on the subject which was a perfectly sensible comment of how you could compare TTing as uposed to climbing, and this on topic...but the thread has gone to blazes since then.
edit, btw that doesn't include Sceptic's first post on the subject which was a perfectly sensible comment of how you could compare TTing as uposed to climbing, and this on topic...but the thread has gone to blazes since then.
martinvickers said:Any chance bike design, aerodynamics and TT's could be discussed...I dunno...on a bike design, aerodynamics or TT thread?
edit, btw that doesn't include Sceptic's first post on the subject which was a perfectly sensible comment of how you could compare TTing as uposed to climbing, and this on topic...but the thread has gone to blazes since then.
Who made you a mod here?
It's not your job to tell when things go OT, let the mods do their work, all you need to do is report posts you think are OT and they will deal with them.
Thanks.
martinvickers
BANNED
- Oct 15, 2012
- 4,903
- 0
- 0
peloton said:Who made you a mod here?
It's not your job to tell when things go OT, let the mods do their work, all you need to do is report posts you think are OT and they will deal with them.
Thanks.
You have a problem with my post? Tell a mod. Otherwise, **** out.
Hehe.StyrbjornSterki said:...
Aerodynamic drag increases exponentially with velocity, not linearly.
...
You're wrong on the internet.
- Apr 30, 2011
- 49,135
- 31,792
- 28,180
Huh?Nicko. said:Hehe.
You're wrong on the internet.
EDIT: Perhaps better for another thread, no?
Give me some time to find a proper one.
- Jul 21, 2012
- 9,860
- 3
- 0
Martin. Lets get back on topic.
What happened to your simple verifiable fact?
You claimed average climbing speeds were down remember?
But we have yet to see any links or sources.
What happened to your simple verifiable fact?
You claimed average climbing speeds were down remember?
But we have yet to see any links or sources.
martinvickers
BANNED
- Oct 15, 2012
- 4,903
- 0
- 0
the sceptic said:Martin. Lets get back on topic.
What happened to your simple verifiable fact?
You claimed average climbing speeds were down remember?
But we have yet to see any links or sources.
I don't really want to go round in circles again, but, one more time
The times are taken from Vetooo's all time lists, published on this forum. Also publishing under the twitter alias @ammattipyoraily, he's widely, if not univesally, regarded as an accurate chronical of historical ascent times. Indeed, when the guys go after Horner or Froome, as often as not, it's his research they are in fact quoting.
IF you can't accept that, you need go no further, that's the main source for raw times. If you have a better source for raw ascent times, I'll be delighted to hear it.
The years for each rider are listed, and the top tens are extrapolated, by myself, directly from that data. I suspect there may be the odd case of counting to 11 rather than 10, etc, and I'm happy to be corrected on it. But on the whole, the method holds.
http://www.fillarifoorumi.fi/forum/...a-km-h-VAM-W-W-kg-etc-)&p=2041608#post2041608
There are limited archives for the Ventoux, because there were no summit finishes there in the Pre-festina years, indeed,i think it only went up once in the 1990's - Poli's win, if memory serves (it may well not).
I've used 10th place rider in each year as a rough approx. of 'the head of the race', 'the heads of state' mainly because Hog introduced his pimpernel 'real study' of the top ten. I'd have happily picked 5th, 20th, 25th etc It also handily gives you a useful figure for the number of riders that year who make top 50, 100 etc all time.
Each of these is essentially a median of twice the number - 10th is the median of the top 19, 20th, the median of the top 39, 25th the median of the top 49 e etc, and has the advantage of not giving undue weight to outliers - so,e.g. if you have a clean pelelton, with two riders doped to the very gills, mean times will be quite effected, but medians not so much. I felt median of the top 19/20 was probably sufficient to capture the #heads of state' most likely to have given full effort. YMMV
Hence why simple, and within the limits of Vetooo's research, verifiable. They have not been made into a separate study, which seems to be what Hog was demanding. I was simply doing the counting myself with the figures available. But the figures are there to work on as people see fit.
I'm not going to get into another argument about averages, and what the word means. A median is a pretty standard 'form' of average to use...more to the point, I was absolutely clear what I was using from the getgo, I never suggested I divided aggregate times by number of riders to find arithmetic means. Which is not to say that I'm not happy to do so, if people prefer.
I have since done that for a number of the climbs, but I'm continuing to work on that, simply because it's time consuming. Broadly, the pattern seems to continue to hold - mean times over the same distance are slower in the last few years than at the festina heights, with the odd anomoly - notably one of the 2009 climbs which seems to suggest a tailwind. I have not put any climactic, tactical, drafting etc details in, because the point was not about W/KG or even about doping - it was absolutely and resolutely restricted only to speed itself.
Peronally, i don't think this proves jack s*** in relation to doping. I never did. I don't think it proves the peleton clean, or anything like it - the only point I was trying to make, in the Walsh thread where this stuff originated was that a perception of a slower peleton MAY have been a factor for Walsh's more 'generous' treatment of Froome than Armstrong. No more, no less.
thehog
BANNED
- Jul 27, 2009
- 31,285
- 2
- 22,485
Peloton....
d'Huez was measured at three different distances. Pantani was on the longer course for the record.
I assume this has been standidised? Who knows? The finish line has moved around 4 times. See LeMond, Hinault v present day.
Some climbs are climbed in both directions. ie Ventoux and Tourmalet.
Then you have stage lead in distances. 1988 the Tour was reduced by around 800-1000km.
2013 Vuelta v previous years holds firm on faster times.
Many many many variables.
Well done for taking the time. To prove that it's not so simple.
I might use the study for my next masters degree.
Although there have already been two studies already on the subject. Vayer comes close but he was looking at the data from a different perspective.
All very interesting. The first study only looked at winners times and also cross correlated age and plotted across a graph. It stopped in 2009.
But I'm done on the subject.
- Jul 21, 2012
- 9,860
- 3
- 0
Will be interested to see what you come up with Martin.
It seems like some riders today are capable of climbing at 90s speeds, but maybe there are more riders in the top 10 that are clean now?
But this is very complicated and far from verifiable and simple so I dont want to draw any conclusion yet on whether the speeds are down or not.
It seems like some riders today are capable of climbing at 90s speeds, but maybe there are more riders in the top 10 that are clean now?
But this is very complicated and far from verifiable and simple so I dont want to draw any conclusion yet on whether the speeds are down or not.
martinvickers
BANNED
- Oct 15, 2012
- 4,903
- 0
- 0
the sceptic said:Will be interested to see what you come up with Martin.
It seems like some riders today are capable of climbing at 90s speeds, but maybe there are more riders in the top 10 that are clean now?
But this is very complicated and far from verifiable and simple so I dont want to draw any conclusion yet on whether the speeds are down or not.
That's very fair. I accept you're less convinced just looking at the raw data than I am, and I think that's a perfectly fair position to take. I'm not infallible (I'm actually quite reasonable when I'm not being trolled ;-)). For the record, it is my understanding, and I stand to be corrected, that Vetooo takes some considerable care to 'standardise' distances as well as times.
I thank you for that. I certainly think it's easier to be convinced that the peleton GENERALLY is perhaps cleanER, than for a second to assume the WINNERS are CLEAN, if you understand what I mean. Nothing in this exercise will ever prove that FRoome, Wiggins, Evans or, say Sastre were clean. It's a broader brush stroke than that.
I might suggest, for the sake of fairness, we could attempt the same exercise with the summit finishes of 2012 and 2011, and indeed, perhaps other GT's, although the field strengths can vary in those (only 2012 really strikes me as a year when the Vuelta, for example, simply seemed a stronger race than the Tour - the giro tends to match up better)
In the meantime, I found this quite interesting from last year. The broad patterns seem similar to what I'm finding, but I'm in no position to peer review some of it, so YMMV
The one thing that stood out for the Sky-sceptics to me, was not wiggins, but Boardman. His performances seem to be completely off the chart. That said, he was a specialist, not a GT rider, so is probably closer to a Tony Martin thn anything else, but it casts an uncomfortable light on Brailsford predecessor, Peter Keen.
THe other obvious things in retrospect is how much the TTT performance, in retrospect, gives Discovery/US postal away, and how much the rot was set long before Armstrong p!ssed us all off - the graph of multiple winners where he and induran are COMPLETELY off the norm may not be very telling, but it looks like it is!
thehog
BANNED
- Jul 27, 2009
- 31,285
- 2
- 22,485
It actually would be a worthy study to do. I wish I had more time to look into it.
Martin here's a study on accent rates for d'Huez using the magical 40 minute mark as a guide.
Doesn't say a whole lot but very interesting data. I think they're only using winners on the l'alpe but let me check.
Well it says a little bit.


Martin here's a study on accent rates for d'Huez using the magical 40 minute mark as a guide.
Doesn't say a whole lot but very interesting data. I think they're only using winners on the l'alpe but let me check.
Well it says a little bit.
The upper-envelope of the fastest ascents of Alpe D’Huez in the TdF. The data has been standardized to the 13.8 km distance. The horizontal red line corresponds to the “magical” 40 minute climb time. Note that the 2004 Armstrong speed was achieved in an individual time-trial and not in a road race.
There are a number of ways to consider this data in efforts to identify underlying trends. One way is to simply consider the average ascent rates as a function of year in which they were accomplished, from which one observes that
The fastest average ascent rates, that exceeded the “magic” 40 minute speed, were accomplished between 1991 (Bugno and Indurain) and 2008 (Sastre)
The 5 fastest ascents were accomplished by Pantani (1997, 1994, 1995) and Armstrong (2004, 2001)
The cyclists that have ascended faster than the “magic” 40 minute speed are (in order of best performance of each) Pantani, Armstrong, Ullrich, Landis, Kloden, Virenque, Mayo, Azevedo, Indurain, Zulle, Riis, Sastre, Bugno, Guirini, Gonzales, Karpets, Moncoutie and Basso.
Information that is relevant to these observations:
The 2004 ascent was an individual time-trial and not a road race.
Cyclists in the sub-40-minute category who are reported to have either tested positive or who have admitted to IPETs are Pantani (haemocrit level of 60.1 in 1995), Ullrich (identified in Operation Puerto in 2006), Landis (admitted to IPETs), Virenque (admitted to IPETs), Mayo (2007, tested positive for EPO, retired), Riis (admitted to EPO), Zulle (admitted to EPO, haemocrit once found to be 52.3%.).
martinvickers
BANNED
- Oct 15, 2012
- 4,903
- 0
- 0
thehog said:It actually would be a worthy study to do. I wish I had more time to look into it.
Martin here's a study on accent rates for d'Huez using the magical 40 minute mark as a guide.
Doesn't say a whole lot but very interesting data. I think they're only using winners on the l'alpe but let me check.
Well it says a little bit.
Yes, I saw that graph, Hog, it is indeed interesting - the whole paper is a touch naive but still i think worth reading. Leaving aside the contentious present, it just shows that Armstrong was not by any stretch above and beyond other dopers of the era - the rot had LONG set in.
And, On a personal note, isn't it much nicer, and more informative, when we just swap info ;-) I think I'll have to keep my word, and let you back in now!!
I'll make you a deal; I'll try and do the 2011-2013 Tdfs for arithmetic means. If you get a chance, you have a crack at doing the same with a recent Vuelta. Compare and contrast.
thehog
BANNED
- Jul 27, 2009
- 31,285
- 2
- 22,485
martinvickers said:Yes, I saw that graph, Hog, it is indeed interesting - the whole paper is a touch naive but still i think worth reading. Leaving aside the contentious present, it just shows that Armstrong was not by any stretch above and beyond other dopers of the era - the rot had LONG set in.
And, On a personal note, isn't it much nicer, and more informative, when we just swap info ;-)
I'll make you a deal; I'll try and do the 2011-2013 Tdfs for means. If you get a chance, you have a crack at doing the same with recent Vuelta. Compare and contrast.
Yes the guy who wrote was an Armstrong "believer' it seems. So I think he was looking for a way to tell the world he was clean.
But he could have gone much further. However his premise was much different.
Yes I will do Vuelta.
But I'm not convinced on the methodology but don't have any better ideas so good for me.
martinvickers
BANNED
- Oct 15, 2012
- 4,903
- 0
- 0
thehog said:Yes the guy who wrote was an Armstrong "believer' it seems. So I think he was looking for a way to tell the world he was clean.
But he could have gone much further. However his premise was much different.
Yes I will do Vuelta.
But I'm not convinced on the methodology but don't have any better ideas so good for me.
That's ok, you don't have to be - it's just interesting for its own sake anyway.
thehog
BANNED
- Jul 27, 2009
- 31,285
- 2
- 22,485
martinvickers said:That's ok, you don't have to be - it's just interesting for its own sake anyway.
Agreed. I mean, i scratch my head for the best method but I think the way you've done it is optimum way as it flatlines out the "OTT" performances a little.
i.e. if the result of massive tailwind or a UCI pass or something.
Plus I think it was based on my original ramblings, a little.
It demonstrates better what the peloton is doing and not so much a select few.
That in itself could be problematic but its a good all the same.
It can be the Wisdon of climbing data
- Mar 10, 2009
- 2,973
- 5
- 11,485
I posted this in June:
http://alex-cycle.blogspot.com.au/2013/06/lalpe-dhuez-again-top-200.html
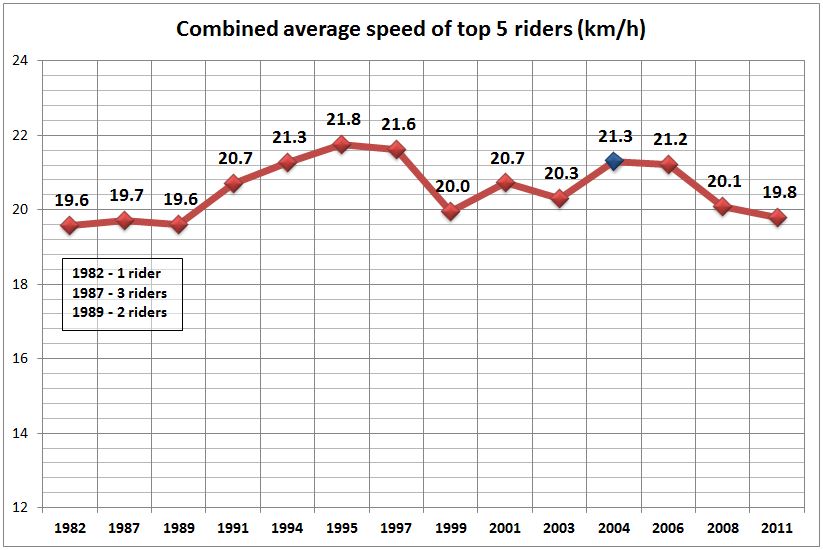
in which I plotted average speed of top 5 on each ADH stage based on the data as referenced:
http://alex-cycle.blogspot.com.au/2013/06/lalpe-dhuez-again-top-200.html
in which I plotted average speed of top 5 on each ADH stage based on the data as referenced:
thehog
BANNED
- Jul 27, 2009
- 31,285
- 2
- 22,485
Alex Simmons/RST said:I posted this in June:
http://alex-cycle.blogspot.com.au/2013/06/lalpe-dhuez-again-top-200.html
in which I plotted average speed of top 5 on each ADH stage based on the data as referenced:
Thats great, thanks Alex. Did you do any other climbs as well?
That graph would look better with a line through when the hematocrit rule came in and then the EPO test.
One further point per context. Pantani's 1987 record on the alps. When watching this era even though the entire teams are jacked they don't really pace the leafed up the climbs like today. You get the leaders basically hitting it out form the base.
Exhibit A: https://www.youtube.com/watch?v=RYnCSSWgTKU - be warned, its fast. Makes froome look clean
These days the leader can draft a lot more than they were pre-Festina or pre-EPO test.
- Mar 10, 2009
- 2,973
- 5
- 11,485
thehog said:Thats great, thanks Alex. Did you do any other climbs as well?
That graph would look better with a line through when the hematocrit rule came in and then the EPO test.
One further point per context. Pantani's 1987 record on the alps. When watching this era even though the entire teams are jacked they don't really pace the leafed up the climbs like today. You get the leaders basically hitting it out form the base.
Exhibit A: https://www.youtube.com/watch?v=RYnCSSWgTKU - be warned, its fast. Makes froome look clean
These days the leader can draft a lot more than they were pre-Festina or pre-EPO test.
Well I didn't collect the data, merely plotted some charts from published data. If reasonably verified data exists on other climbs then I'm happy to see what can be sensibly plotted. I make no claim about the validity of the data used.
1990: EPO use began
1997: HCT rule introduced
1999-2000: EPO testing was developed leading up to Olympics (first EPO +ve was in 2002)
2008: bio-passport introduced by UCI
But as with many things, trend data is often not a good way to assign a causal link to an individual data point, only to suggest probabilities.
Bit like understnading the difference between trend of climate change and individual weather events.
TRENDING THREADS
-
 Paris-Roubaix 2026, one day monument, April 12
- Started by Lequack
- Replies: 2K
-
 Itzulia Basque Country 2026, April 6-11
- Started by Dazed and Confused
- Replies: 2K
-

-
 Ronde van Vlaanderen 2026, monument, April 5 (men's)
- Started by Krzysztof_O
- Replies: 1K
-

-
 Liège - Bastogne - Liège 2026, one-day monument, 26th April
- Started by Krzysztof_O
- Replies: 167
-

Cyclingnews is part of Future plc, an international media group and leading digital publisher. Visit our corporate site.
© Future Publishing Limited Quay House, The Ambury, Bath BA1 1UA. All rights reserved. England and Wales company registration number 2008885.