- May 17, 2013
- 7,585
- 2,502
- 23,180
Re: Re:
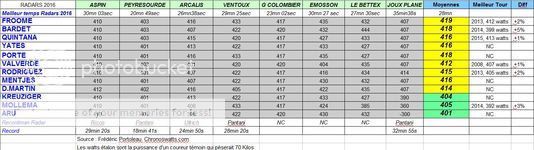
") . Some disagree with the accuracy, but it's proven to set a realistic bar, and from year to year compares apples to apples.
. Some disagree with the accuracy, but it's proven to set a realistic bar, and from year to year compares apples to apples.
If only 4 riders were flagged from '10-'15 and 9 this year, I wonder: has something changed in '16? It seems like the bikes are being scanned seriously at the Tour, so I would discard mechanical doping. Is there a new product or cocktail in town? It would explain how some get sick, some over-perform 9as in respond well), and some look weak: are they on last year's stuff and it's not enough? Or on (more or less) nothing and they will be out of cycling in two years? Is a new era of doping beginning before our eyes?
I like his calculation method as described/detailed in "Not Normal", which I keep in that special folder with the Pinot studiesLe breton said:Alex Simmons/RST said:So on average the fastest riders in this tour were 100 seconds (7%) slower than Pantani et al.
Ranging from 42 to 160 seconds slower.
Why is 410W suspicious?
It's not the 410 W per se that Vayer deems suspicious, but 410/70 = 5.86 Watts/kg on the LAST climb of a heavy mountain stage. 70 kg = weight of std cyclist.
This for a 30-40 min. effort.
See here
http://sportsscientists.com/wp-content/uploads/2014/07/2013-vs-2014-Tour-power-outputs.png
Cheers
PS : Ventoux should have been excluded from the average I think (wind)
. Some disagree with the accuracy, but it's proven to set a realistic bar, and from year to year compares apples to apples. If only 4 riders were flagged from '10-'15 and 9 this year, I wonder: has something changed in '16? It seems like the bikes are being scanned seriously at the Tour, so I would discard mechanical doping. Is there a new product or cocktail in town? It would explain how some get sick, some over-perform 9as in respond well), and some look weak: are they on last year's stuff and it's not enough? Or on (more or less) nothing and they will be out of cycling in two years? Is a new era of doping beginning before our eyes?