Durden93 said:
I could be wrong here, but I had Chaves, Froome, Contador and Quintana at 9:27 for the final 3km. Anyone want to take a guess for the w/kg?
I wouldn't mind giving a value for the whole climb, but there is a slight discrepancy between two sources, this one
http://www.altimetrias.net/aspbk/verPuerto.asp?id=379
and climbing-records
http://www.climbing-records.com/.
4km and 496 m for the first
3.9 km and 488 m for the second.
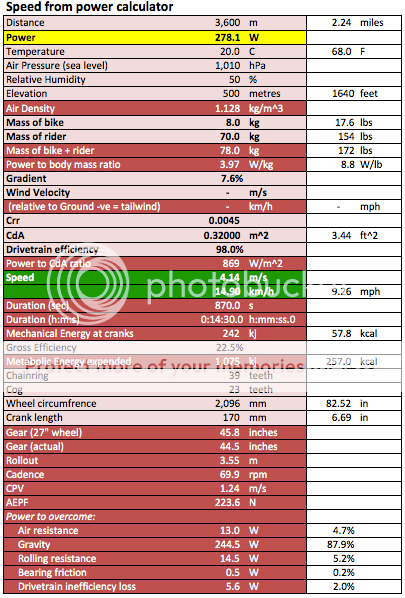
Taking the second set of data and not trying to be very accurate, I find that to go up that climb in 15:26 (from climbing-records) you need, if you weigh 67 kg, 424 watts, i.e 6.33 W/kg.
I have taken a CdA of 0.35 m^2, an air density of 1 kg/m^3 and 0.0045 for the road friction just to get an idea.
PS : PS : the av. altitude was only about 750m, so maybe increase air density to 1.07, if you push CdA to 0.375 and rolling friction to 0.005, you end up at ~ 6.4 W/kg.IF THE CLIMB IS + 496 m (vs 488), you get 6.5 W/kg.
Of course with no wind, no drafting behind other cyclists or cars
")