
- Aug 27, 2012
- 1,436
- 0
- 0
Zinoviev Letter said:2) There are the blood values. This graph illustrates the trend very well:
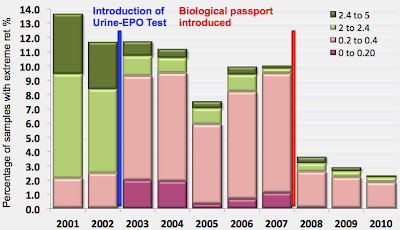
What's with the 0-0.2 values for the 2 outside periods. Ie. why is there no data on this? Methodology changes? Or just not reported? Looks odd.
And is there data on the sample tested. How has the sampling methodology changed over the years? Which we know it has. And how these changes may (I said "may") affect the results.
And changes in the testing technology/methods itself and how this may affect testing result/accuracy.
Has this data been published in a formal paper with subsequent discussion?
")


