- Jul 27, 2010
- 5,121
- 884
- 19,680
miguelindurain111 said:According to French pseudoscientists Froome's numbers on his legendary clean break were
- Finestre 64 min at 5.14 W/kg (including 28 min at 5.57 W/kg)
- Sestrieres 21 min at 5.29 W/kg
- Jaffereau 25 min at 5.43 W/kg
https://mobile.twitter.com/lapreuvepar21/status/1001165650210025473
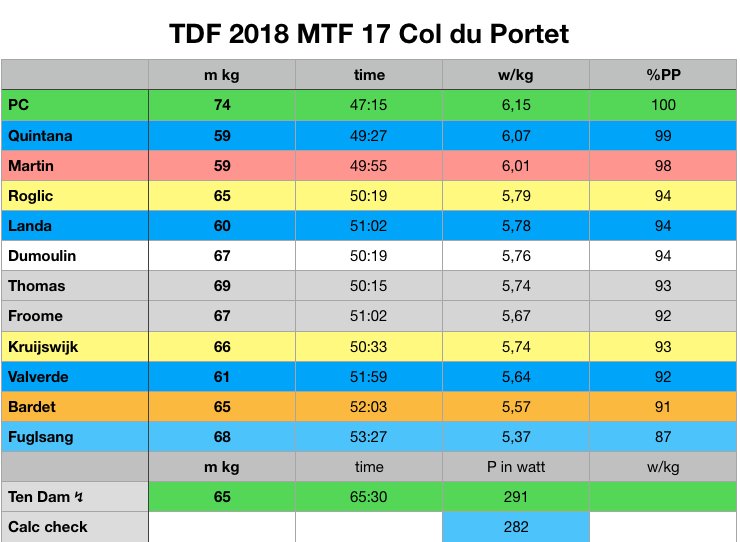
The link provides just watts, the W/kg values seem to assume 67 kg, which is probably close to the correct weight. Also, according to the link, Finestre was done at 360 watts, slightly higher than Siestrieres, and corresponding to 5.37 W/kg. Anyway, as I’ve noted before, these values are quite close to Floyd’s in the Morzine stage. Assuming a body weight of 68 kg, his average power over the first 30 minutes was 5.90 W/kg, and his power for the last two hours (not including descents) was 5.35 W/kg. The actually pedaling in the last two hours was apparently about 105 minutes, which is close to the 110 minutes Froome spent climbing Finestre, Sestrieres and Bardo.