- Apr 30, 2011
- 48,475
- 31,046
- 28,180

Netserk said:http://www.climbing-records.com/
FasterDekker_Tifosi said:How fast was Bales compared to 2007 (T.Dekker on full blood transfusion enriched EPO blood)?
Col de Peyra Taillade
2017:8,5 km@7,3%---22:03---average speed 23.13 km/h(Christopher Froome)
---22:41---average speed 22.48 km/h(Vuillermoz-Bardet-Uran-Aru-Contador-D.Martin-Landa-Meintjes-S.Yates)
---23:17---average speed 21.90 km/h(Waren Barguil)
Barguil climbs Peyra Taillade at ~6.0 w/kg. Group of 9 favourites at ~6.1 w/kg. Froome flew at ~6.4 w/kg!
I would have thought x-headwind if the climb heads east since the wind was coming from NE most of the dayNetserk said:Just for context, there actually was a tailwind on the climb today. Nonetheless, nice ride.
Just rewatching the climb, especially the section Froome was alone/with Landa and looked for flags that weren't being waved by spectators.Eyeballs Out said:I would have thought x-headwind if the climb heads east since the wind was coming from NE most of the dayNetserk said:Just for context, there actually was a tailwind on the climb today. Nonetheless, nice ride.
https://www.windfinder.com/report/loudes_le_puy/2017-07-16
The Science of Sport said:Hi Folks
Interesting discussion. And seeing how I threw out that 6.2W/kg figure, I've also been interested in tracking the stats.
Unfortunately, we never see the real numbers from the top men, but we can get a lot of data off the SRM website (http://www.srm.de/). So here are some "facts":
1. Chris Horner:
On the short climb (3km) up to Mende the other, Horner finished 31 seconds behind Contador, having begun the climb with him. Horner's average power output for 10 minutes of climbing was 6.6 W/kg (422W). Nothing wrong with that, it's a really short effort.
For context, consider Horner on Ax-3-Domaines the other day. That climb took him just under 24 minutes, and his power output was 5.8 W/kg (370W). He conceded about 90 seconds to Schleck and Contador and co.
Then even longer was the climb of the Port de Pailheres, which took 48:37, and that was done at 5.4W/kg (344W). Of course, it's not a finishing climb, so the hammer isn't down, but it does reflect what the peloton is doing.
Edit: Also, Horner's data from the Port de Bales are interesting. He finished this day with Basso, conceding approx. 3 minutes to Contador's group by the finish (not 100% sure of the gap at the summit, but imagine it would be 3 min ± 20 seconds). This climb took 49:30, and was done at an average of 342W/kg (5.2W/kg - about the same as the Port de Pailheres of similar duration).
And then very interesting, we also have the data of Chris Anke Sorensen, who has been the last man to peel off for Andy Schleck. And on the Port de Bales, he rode at the front of the peloton for 21:34 and produced 6.1W/kg. The smaller Schleck, riding behind him, would produce less than this - perhaps 5.8W to 6.0W/kg, and that's a good indication of the power produced by those top contenders.
How much are those 90 seconds worth? Using the SRM to 'validate' your calculations, it might be interesting to calculate. Will have a look later, just have to sort out some things first. Cozy Beehive will beat me to it and probably do a better job than I can...
But I think the Tour is substantially slower. The days where climbs lasting 40 minutes or more were done at even just above 6W/kg WITH attacks are no longer with us...and never mind the 6.7W/kg that we've heard of, and know that guys were producing for close to 40 minutes.
On the note of Portoleau, I do feel that all he needs to do is give the times. He has this massive database and if you could show that they did Ax-3-Domaines 90 seconds slower than in previous years, that's compelling. Even with temperature and race situation, you'd have a tough time explaining that difference away entirely. And then the other thing to do is take the average time of the top 20, and positions say 50 to 60, to get an idea of depth. Almost certain it's a lot slower.
The other thing about the power, as Martin points out, is that in theory, if they rode one pace, they'd be faster. But I don't remember one paced riding too often. There are always attacks. Schleck-Contador was extreme the other day, but that's why it would be most interesting to look at the depth and quality.
You can see it in the racing, because as fierce as the attacks are, they're not doing the same damage as previous years, they're less frequent and interspersed with much slower riding, and the guy in the breakaway (Voeckler and Riblon) have held off.
Ross
Valv.Piti said:So I did these climbs in Italy. I wondered what my w/kg was:
Muro di Sormano, 1,8 km, 15,5%, 14 min 30 sec.
First 4,4 of Madonna del Ghisallo, 4,4 km, 8,5%, 20 min
Alpe di Cainallo minus the last 2 kilometres, 16 km, 6,5%, 1 hour and 4 min
16 kilometres so thats 3,7 w/kg. That makes sense since its a considerably longer effort. Thanks!Durden93 said:Valv.Piti said:So I did these climbs in Italy. I wondered what my w/kg was:
Muro di Sormano, 1,8 km, 15,5%, 14 min 30 sec.
First 4,4 of Madonna del Ghisallo, 4,4 km, 8,5%, 20 min
Alpe di Cainallo minus the last 2 kilometres, 16 km, 6,5%, 1 hour and 4 min
3.94 for the second, the 3rd is either 3.7 or 3.16. I can't tell from your post whether the climb was 14km or 16km. Ferrari's formula doesn't apply to gradients over 11 so I can't tell you about the first climb. Hope you enjoyed it!
Durden93 said:Netserk said:http://www.climbing-records.com/
6.25w/kg. Not sure how I feel about that given the tough day.
Watch it Valv.Piti, you're being discussed in the clinic nowValv.Piti said:16 kilometres so thats 3,7 w/kg. That makes sense since its a considerably longer effort. Thanks!Durden93 said:Valv.Piti said:So I did these climbs in Italy. I wondered what my w/kg was:
Muro di Sormano, 1,8 km, 15,5%, 14 min 30 sec.
First 4,4 of Madonna del Ghisallo, 4,4 km, 8,5%, 20 min
Alpe di Cainallo minus the last 2 kilometres, 16 km, 6,5%, 1 hour and 4 min
3.94 for the second, the 3rd is either 3.7 or 3.16. I can't tell from your post whether the climb was 14km or 16km. Ferrari's formula doesn't apply to gradients over 11 so I can't tell you about the first climb. Hope you enjoyed it!

Valv.Piti said:16 kilometres so thats 3,7 w/kg. That makes sense since its a considerably longer effort. Thanks!Durden93 said:Valv.Piti said:So I did these climbs in Italy. I wondered what my w/kg was:
Muro di Sormano, 1,8 km, 15,5%, 14 min 30 sec.
First 4,4 of Madonna del Ghisallo, 4,4 km, 8,5%, 20 min
Alpe di Cainallo minus the last 2 kilometres, 16 km, 6,5%, 1 hour and 4 min
3.94 for the second, the 3rd is either 3.7 or 3.16. I can't tell from your post whether the climb was 14km or 16km. Ferrari's formula doesn't apply to gradients over 11 so I can't tell you about the first climb. Hope you enjoyed it!
meat puppet said:So doc veloclinic thinks the tour was not what he would call cleans. On top of that he speculates that judging by his analysis of climb times no new superfuels or other methods are available or at least on use. Not a very extraordinary paitsi of claims by any means.
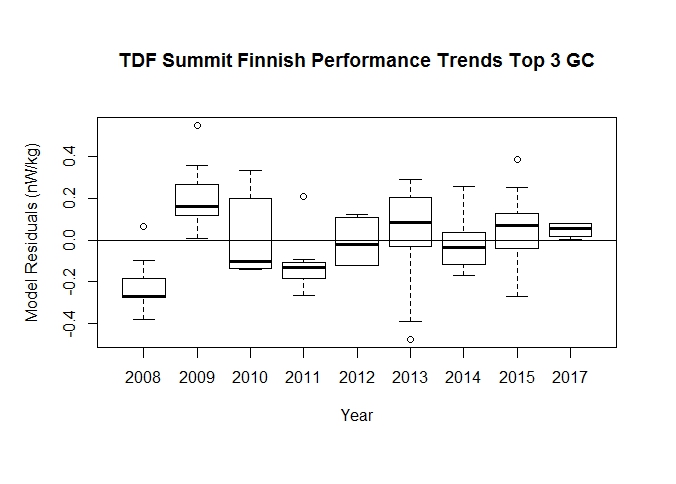
The good news, and I’ll call it that as much as my popularity seems to hinge on playing does it dope, is that over the past 10 years there does not seem to be an emergence of some new doping rocket-fuel. I’m by no means naive enough to see this as evidence of a clean sport. But it does at least support the idea that the illicit march has stalled for now.
Not sure how you draw that conclusion from the residuals chart?meat puppet said:In the graphs 2013 is hilarious. So is 2009. Long live Contador & Froome.