- Apr 7, 2011
- 4,887
- 465
- 16,580
Quintanas time of 40:15 meas he would have done Alpe in 38:50 if we assume the same weather conditions. Make of it what you will.

Netserk said:Well, it's hardly the only super performance so far. It's been a fast year.Durden93 said:If the numbers are right, either there was some sort of latent factor or the peloton is on jet fuel this year.
He was, but he was climbing incredibly well in that last week on Alpe d' Huez (he was the strongest of the favourites) and obviously the stage he won to Semnoz, beating Froome and J-Rod with Contador 3 minutes down the mountain.Escarabajo said:His performance was very similar to Alpe 2013 and he was very young at the Tour.
Brullnux said:Jens says this was the same as Froome psm, which is incredible really. I don't think Nairo has that much more room to improve until he reaches his peak. It means that effectively all the top 5 were doing 6w/kg or thereabouts. They are all in great shape. The Giro is still open I think.
How is that?Bavarianrider said:Quintanas time of 40:15 meas he would have done Alpe in 38:50 if we assume the same weather conditions. Make of it what you will.


I will make nothing of your comment because it is not supported with any backing for your claim.Bavarianrider said:Quintanas time of 40:15 meas he would have done Alpe in 38:50 if we assume the same weather conditions. Make of it what you will.


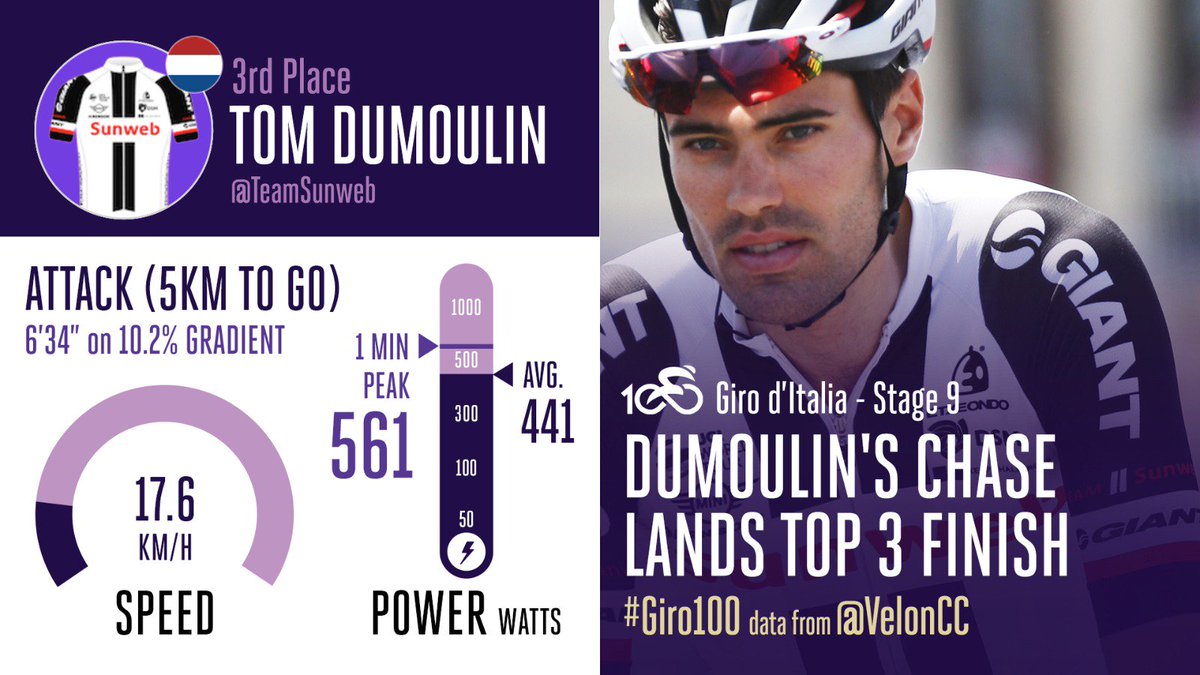
Dekker_Tifosi said:Well Dumoulin's velon data was this:
Note: this was just the attack bit (from 5km to 3km approx)
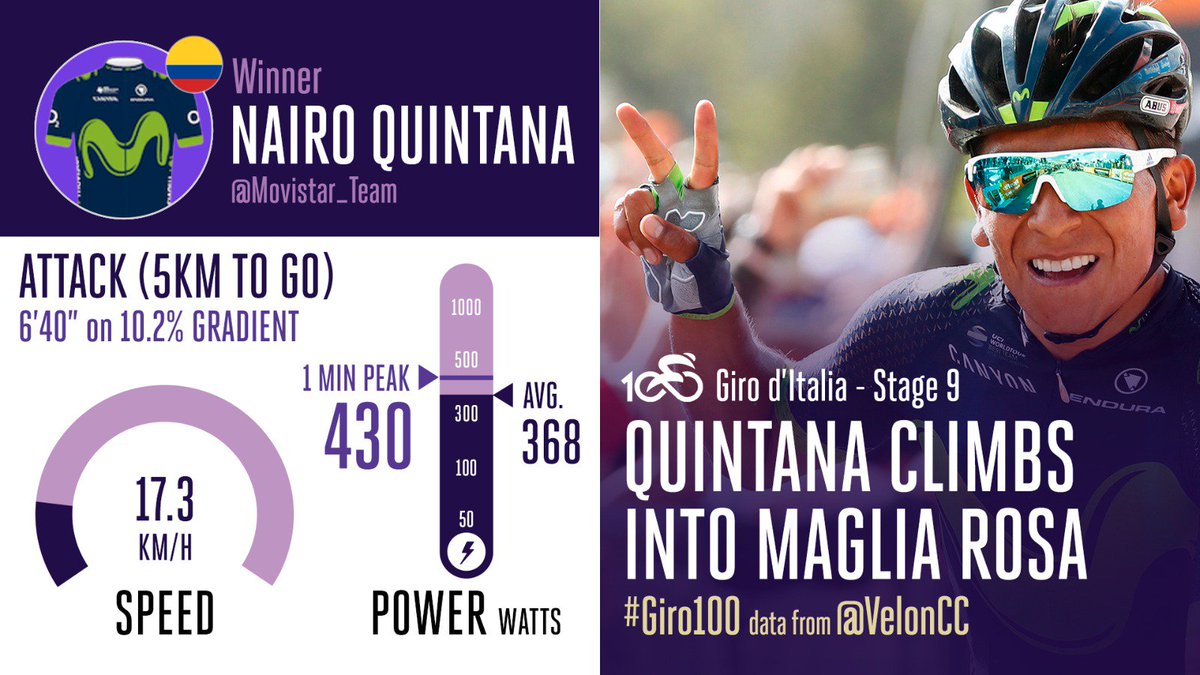
This was Quintana
In pure power output Dumoulin is looking good for the TT.
SeriousSam said:I doubt they completed the last 5km in about 7 minutes.
SeriousSam said:I doubt they completed the last 5km in about 7 minutes.
Dekker_Tifosi said:Note: this was just the attack bit (from 5km to 3km approx)
Without the mechanical, I'm pretty sure. I had the '99 footage and todays' stage running parrallel.Brullnux said:6.7 w/kg apparently. It was only 20 minutes but still.
Only 30 seconds slower than the pirate.
Big gaps considering the climb though.SeriousSam said:Minimal gaps to the other though. Entire field was quick today. Short __/ stage after an active recovery sprint stage with Movistar setting a sharp tempo from the bottom of the climb.
Yes, context is kingSeriousSam said:Minimal gaps to the other though. Entire field was quick today. Short __/ stage after an active recovery sprint stage with Movistar setting a sharp tempo from the bottom of the climb.


