• The Cycling News forum is looking to add some volunteer moderators with Red Rick's recent retirement. If you're interested in helping keep our discussions on track, send a direct message to @SHaines here on the forum, or use the Contact Us form to message the Community Team.

    In the meanwhile, please use the Report option if you see a post that doesn't fit within the forum rules.

    Thanks!

The worst of race profiles

Page 5 - Get up to date with the latest news, scores & standings from the Cycling News Community.
Tour of Romandie 2018 prologue

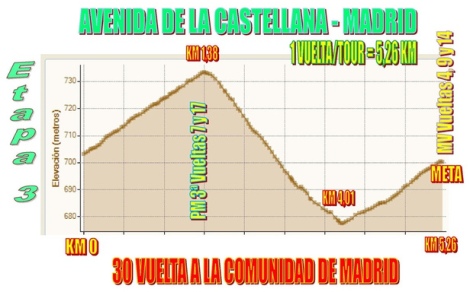
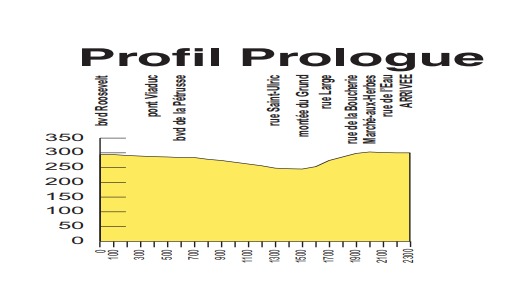
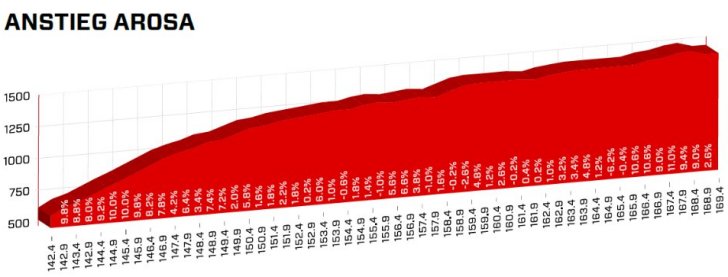
Why would anybody put up this:
mrd9hx.jpg


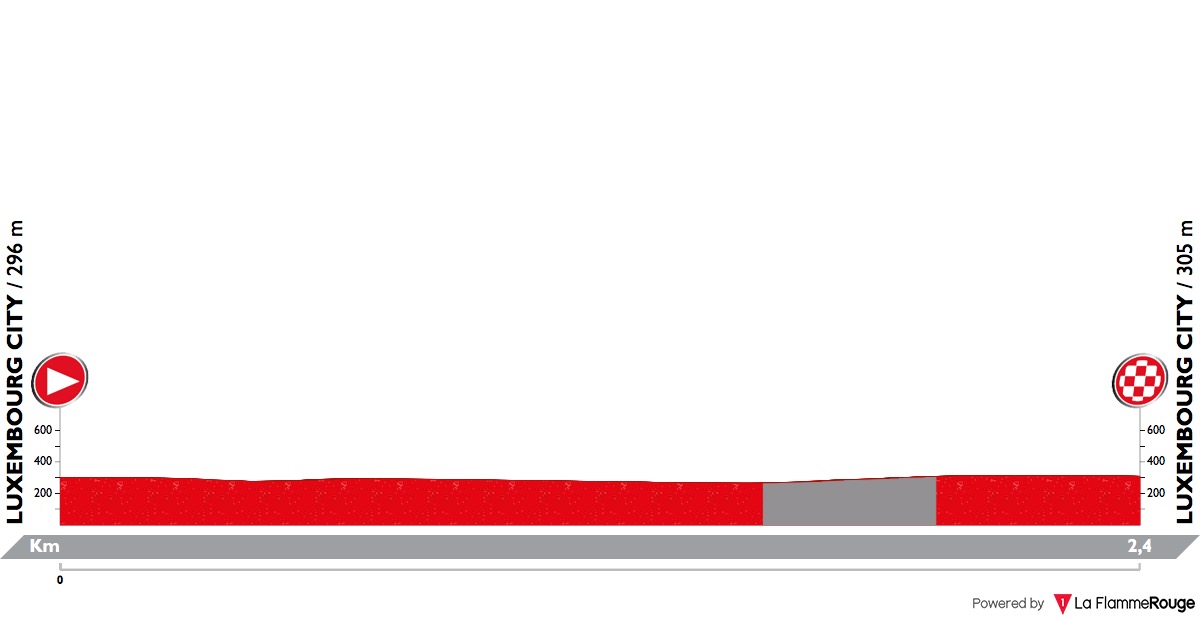
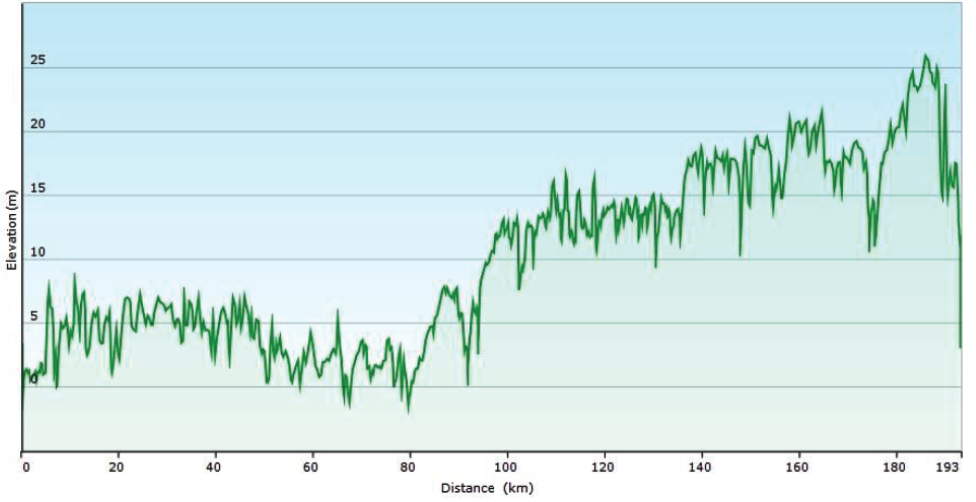
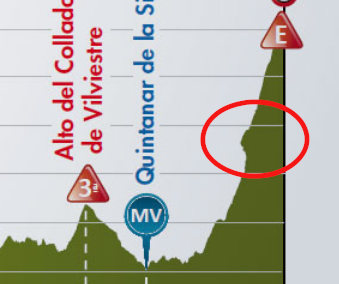
if the race looks like this (top one of these three):
b3RqDVG.png


Why would they try to hide that from us?
 
I have written this numerous times in this thread before, but I have to repeat it. Someone must have thought "this profile is a good idea". Someone must have thought "having a non-linear x-axis is a good idea". Why the hell would anyone think that? Why?
Most people here just find these profiles funny I honestly lose faith in human intelligence looking at this piece of crap. What on earth where they thinking?
 
Looks like someone told a kid; "Look, they're going up one climb, down on the other side, and then up another climb to the finish."
Then the profile makers just added kilometer markers so it would fit with the top of the (first) climb, the bottom of the descend, and the finish.
 
Maybe the profiles did have a linear x-axis at the beginning because someone chose to have expected racing time along the x-axis instead of kilometres (which it then was changed to later), which could explain why the descending part is more compressed :)

To a mathematical mind that makes sense - in reality, not so much.
 
Gigs_98 said:
I have written this numerous times in this thread before, but I have to repeat it. Someone must have thought "this profile is a good idea". Someone must have thought "having a non-linear x-axis is a good idea". Why the hell would anyone think that? Why?
Most people here just find these profiles funny I honestly lose faith in human intelligence looking at this piece of crap. What on earth where they thinking?

They did the best they could. Most of these lesser races are run by volunteers, often of the older generation. There's no knowledge or budget for IT design stuff. It's hard enough to keep the race running, finding sponsorship money, dealing with local authorities, UCI, teams etc. - having a fancy website or stylish profiles is not very high in their list of priorities.
 
Hello Pologne once again. Nevermind the Katowice sprint stage, which once again looks like a 7h journey through Beskid Wyspowy.

e_1_2.jpg


This time the guys at Pologne decided to change the name of Przełęcz Salmopolska (Salmopol Pass) for 90 lat Salmopolu w Szczyrku, which roughly translates to... 90 years of Salmopol in Szczyrk. This is some Vuelta-esque level of naming (Caravaca Año Jubilar 2017 - El Pozo Alimentación). BTW, it's the same finish as in 2017.

e_3_2.jpg
 
railxmig said:
Hello Pologne once again. Nevermind the Katowice sprint stage, which once again looks like a 7h journey through Beskid Wyspowy.
This time the guys at Pologne decided to change the name of Przełęcz Salmopolska (Salmopol Pass) for 90 lat Salmopolu w Szczyrku, which roughly translates to... 90 years of Salmopol in Szczyrk. This is some Vuelta-esque level of naming (Caravaca Año Jubilar 2017 - El Pozo Alimentación). BTW, it's the same finish as in 2017.
I know this is much later than when you posted, but this also deserves a shout out. Not only do they forget how 3D works in the first section, we also have a KOM Summit before the start of a climb (93 km) and part way up a climb (124 km). That very first climb is 3% and also, according to the map, its summit marks where km0 actually is.
Y8GncG6.jpg
 
Just now noticed profile of today's stage in the Suisse:

csm_Profil_3D_7Etappe_29ba55dfcf.png


According to the profile they should climb for the first 10 km, but the elevation given for the first hill is less than for the start? Then in the flat section in the middle elevation of the first place is 511m and it seems the road slightly climbs after that, but the elevation of the next point is 459m and then the next one after yet more climbing 497m...
 
Re:

PeterB said:
Just now noticed profile of today's stage in the Suisse:

csm_Profil_3D_7Etappe_29ba55dfcf.png


According to the profile they should climb for the first 10 km, but the elevation given for the first hill is less than for the start? Then in the flat section in the middle elevation of the first place is 511m and it seems the road slightly climbs after that, but the elevation of the next point is 459m and then the next one after yet more climbing 497m...

The saddest thing about this profile is that it's the "mountain" stage where we expect the biggest time differences.
Yes, somehow the organisers managed to design a race with only 5 big climbs in 9 days.
In Switzerland.
 
Re: Re:

rghysens said:
PeterB said:
Just now noticed profile of today's stage in the Suisse:

csm_Profil_3D_7Etappe_29ba55dfcf.png


According to the profile they should climb for the first 10 km, but the elevation given for the first hill is less than for the start? Then in the flat section in the middle elevation of the first place is 511m and it seems the road slightly climbs after that, but the elevation of the next point is 459m and then the next one after yet more climbing 497m...

The saddest thing about this profile is that it's the "mountain" stage where we expect the biggest time differences.
Yes, somehow the organisers managed to design a race with only 5 big climbs in 9 days.
In Switzerland.
Dunno much about Stage design but the stage was enjoyable.
 

TRENDING THREADS